
BTC Volatility Important Levels

Rules:
A) Information shared below is confidential and cannot be published in part or in full, online or offline. It is intended for the subscriber's benefit only.
B) You agree to the above term before proceeding to read below.
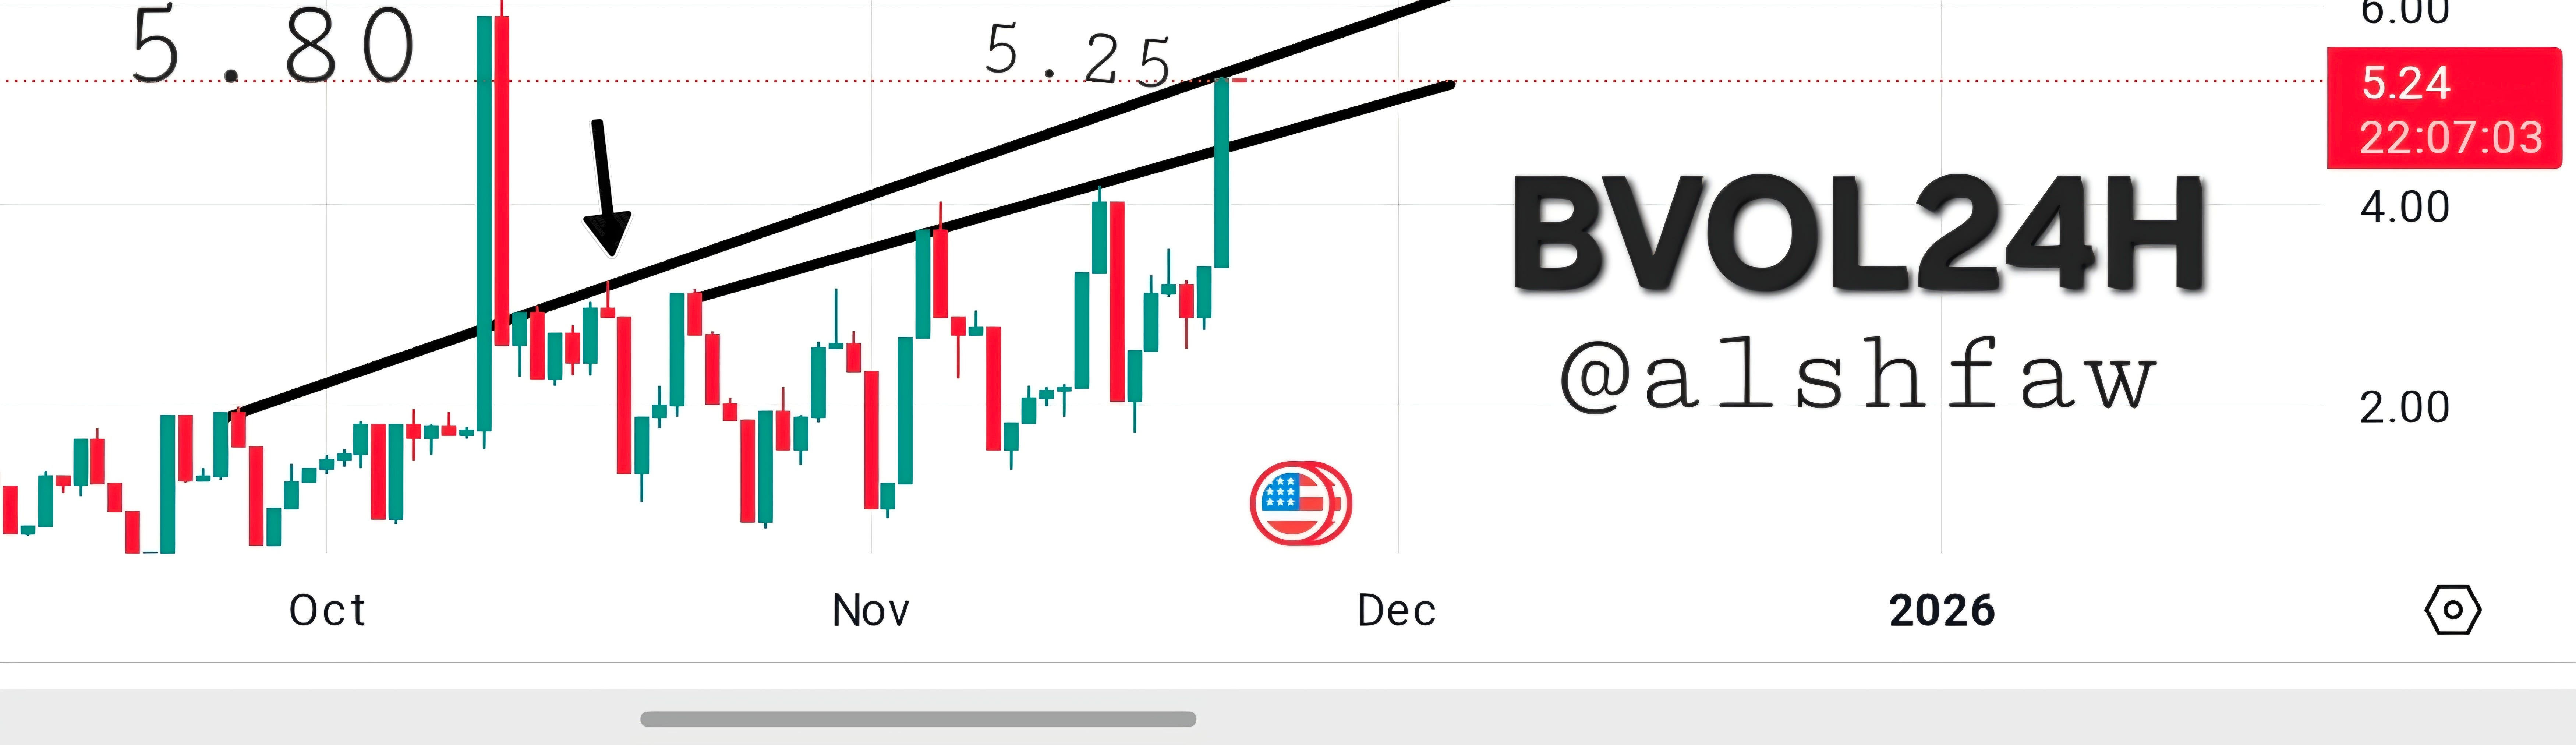
The ticker BVOL24H measures the 24H Bitcoin volatility. See Picture below.
When BTC reverses, normally, you can go back in history, you will see one long green candle followed by a red candle of equal amount almost, a full reversal / capitulation style. See the October reversal in the picture.
Today, BVOL24H built a long enough candle IMHO that can reverse tomorrow. This is why I have been asking for a bottom in BTC at the $85k level.
While the price of BTC can go to $77k, nothing can stop it on a price basis, I see in the BVOL24H no path to higher Vol than current levels at 5.25, I do not think that there is a geometric path to the previous highs from October.
Therefore, I conclude again based on this chart that the Bitcoin bottom is in.
This is not opinion, not bias, it is a geometric reality. See the black arrow where the highest node is.
It is not a usual thing to do analysis on this ticker, but this is zan for you 😘
Thank you Sir. What about the upside EOY? Do you think BTC will rally with QQQ and SPY EOY given that they are moving in tandem from quite some time now or do you see any path of divergence in near future ?
🤝