
$NVDA Analysis - just before its earnings report 05/20/26.

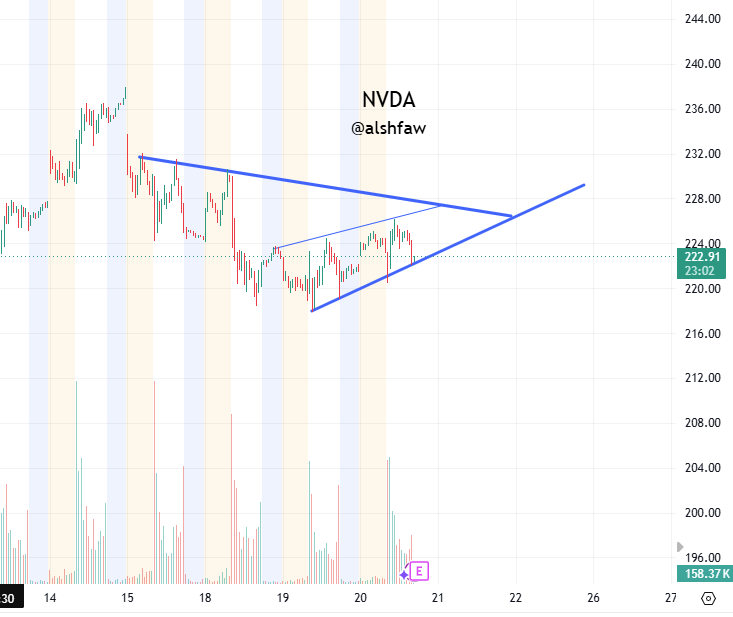
In a wedge, see picture, trading against the support line, leaving blank space below the resistance line. This is coiling against support, and can result in a bullish break-out, meaning the destination becomes the upper line and if news is positive break out.
Gamma is net positive on NVDA by $1.5 billions towards the $240 and $250, but the market maker has a history with NVDA to clear the order book in both directions as it will feed both bulls and bears after hours. It is all about this cash cow and overnight IV crush on $NVDA options.
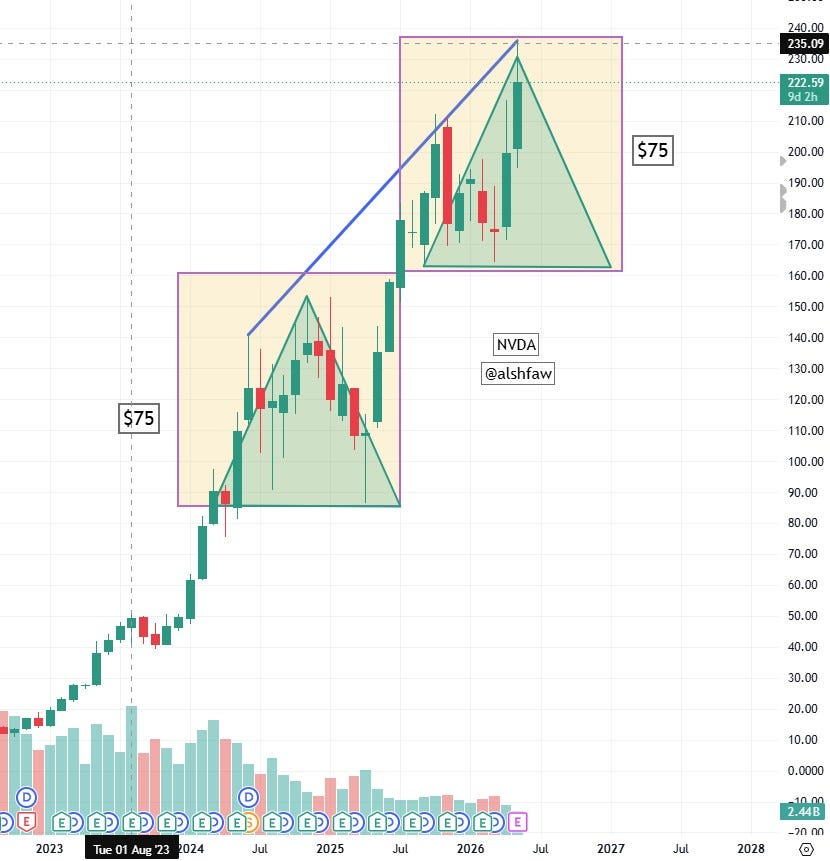
On the monthly on $NVDA, the picture I see is more different, I see two fractals trading similarly, 2025 vs 2026 with a box height of $75. I believe that $240 NVDA is the monthly height on a closing basis. And the following months will see the NVDA price go down the triangle similar to the previous fractal. This is not rigorous analysis based on EPS, it is a geometric similarity only. If NVDA holds this height in May on a monthly closing basis, and go down from here in June, then this analogy will have served its purpose. See 2nd picture.
And monthly:
Hi Zan. Reading this, I thought this was leaning bullish near term but in the group chat you mention it can go down. I'm a bit confused on how to read your analysis, if there is some guidance you can provide, id greatly appreciate ☺️🙏