
SPY Setup Next 2 Weeks | 03/01/2026

Rules:
A) Information shared below is confidential and cannot be published in part or in full, online or offline. It is intended for the subscriber’s benefit only.
B) You agree to the above term before proceeding to read below.
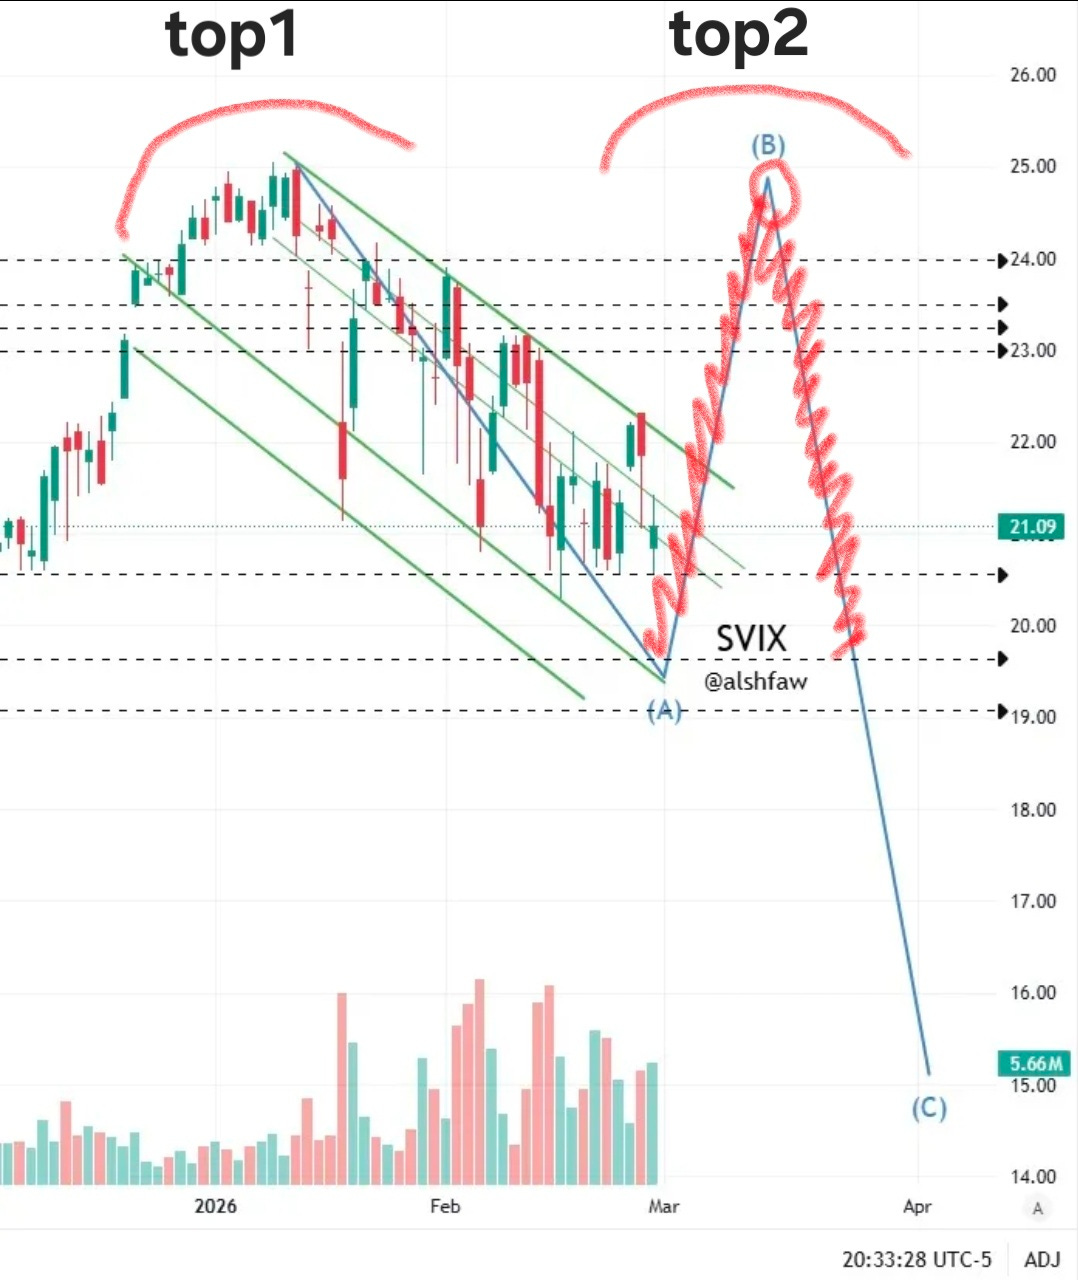
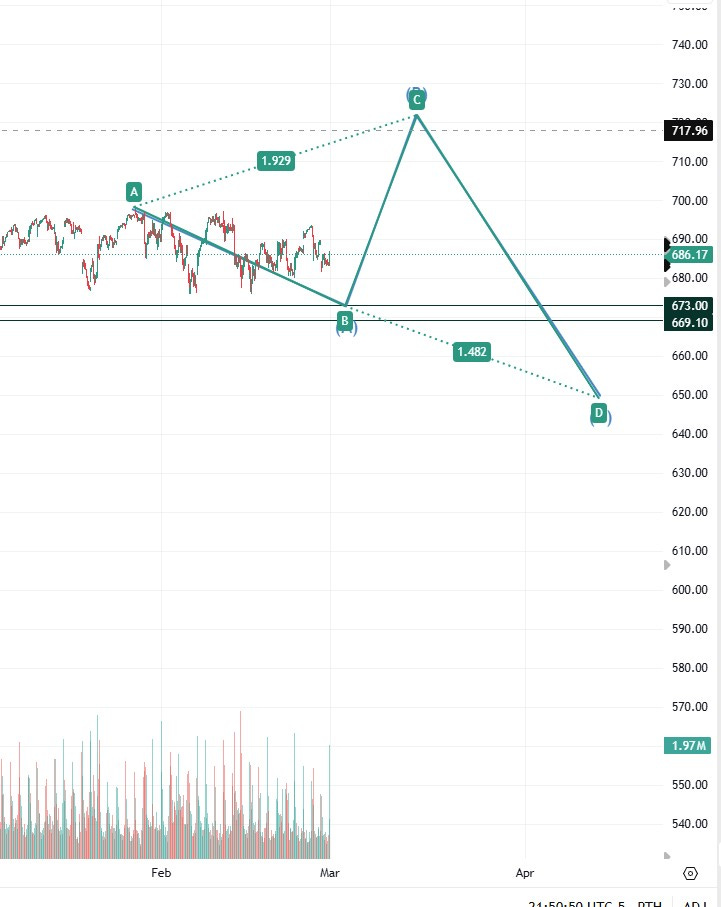
In my last update on SPY, I was thinking the current drop would take us to $673 in a corrective ABC wave following the Elliott Wave cycle completion on SPY which lasted from April 2025 (wave 1) to January 2026 (wave5) with the ~$697 cycle top. See picture below. On the SVIX chart, this top shows as top1 at $25.
SVIX is a cleaner chart to look at than SPY, and they both go in the same direction. If SVIX is up, SPY is up, generally speaking. The SPY price action looks different, skewed higher, because the mag7 act as a rubber band pulling higher on the price (fictitiously).
Since it is really rare for the stock market to seriously correct without a double top — confirming the first top, then one would put forward the idea that top2 is still ahead of us, as illustrated below, and that Mark Newton’s $730 or my mandatory $720 is still possible. This is not a stretch of imagination given how bearish the sentiment is right now, any good news on the war front, a truce, etc. even for 10 days can give the market the chance to go put this top in a V-recovery blow-off top style as bears capitulate out of their Armageddon level puts. At top2, full bear capitulation, we get the final Euphoric Exit after everyone turns euphoric bullish.
I charted my equivalent ABC on SPY, it should look like this. The harmonic ratio is 2x on it. This means the drop from ~$697 to $673 is $25, and we regain on the way up twice that, so $50, so $673+50 = $723, let’s call it $720 since the harmonic is 1.929, if we do the golden ratio expansion to 1.618, that’s $25 x 1.618 = $40, so at $713
So from Monday/Tuesday, we will watch the SVIX to see if it bottoms at $19.50, bottom of the channel in the first picture, then the good news will come possibly end of Tuesday. I drew a picture in the chat channel of how on Monday the price stabilizes, and voltage is built overnight for a $10 SPY / $100 SPX vaxtro down to $673 on Tuesday which will be bought marking the bottom of Wave A of the ABC structure, call this Iran Phase 1 bottom on the Full Moon day of 3/3 Tuesday / Eclipse day.
I filter out the news, so this setup may sound crazy given all of the news out there this weekend. I think of the market price action as the driver for the news, not the other way around. They will enter a truce with one DJT tweet when the price decides to go up. Iran is more or less a done deal and the Saudi Trump plan for peace in the middle east will complete this summer ahead of the mid-term elections; Trump’s biggest achievement. And if Khomeni is gone, then Netenyahu’s job is done, the good cop/ bad cop role in the region collapses, so expect Netanyahu to disappear in the next few months (my prediction, this should trade on Polymarket).
WARNING. During the dot-com era, when the 2nd top was forming in the late 1990’s, and everyone was expecting a Wave C drop, like the one I drew above to $650, the market did the unthinkable, the bearish sentiment was so extreme like now, the market kept going up for an extended Wave 5 instead of an ABC correction, this means after $720 will come $730 or $740 😄. Please be mindful of these risks because history may repeat. SVIX is the ultimate guide to see if top 2 > top 1. Otherwise for the ABC on 03/13 we crash.
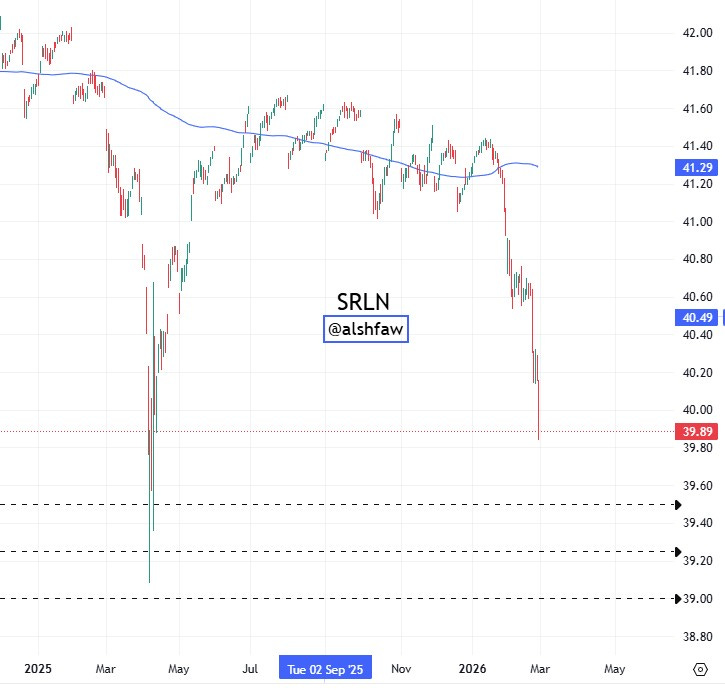
Finally, this weekend BofA’s Hartnett put an important note on how private credit is imploding and this maybe in part why the SPY price has been dropping, he argued if the Senior Loan index drops below $40 that the market may see a flash crash like in April 2025, and this ETF did close below $40 on Friday ⚠️. The Iran war can make this get worse in the new week. So we also need to watch this index closely. See how it is going to levels last seen during the crash prior to Liberation Day. The banks have been falling for this reason. If the Feds allow this to continue this coming week, then a flash crash is possible (Iran + Private Credit), otherwise look for the feds to inject money in stealth mode Monday, easing, or even emergency cut rates which will support the bullish thesis. Another idea for a bullish thesis in my mind is that BTC has a weekly buy-9 setup on March 19th. So liquidity should ease in the foreseeable future.
In summary, a risky setup, but you can avert risk by following the SVIX chart precisely, that declining channel is not allowed to be breached to the downside, hard bottom at $19.50, if this holds, it reverses higher, then the bullish case is in play. Drop below $19.50 then Hartnett’s flash crash scenario becomes a reality. If we go up on Monday inexplicably, then Powell is working hard printing new $$$ to mitigate credit risk.


Zan, thank you for this incredibly detailed breakdown and appreciate you connecting all the dots. Will be watching SVIX $19.50 closely on Monday. 🙏
For this setup, would it be better to buy 3/12 or 3/13 calls (as in, do we start 3/13 green then dip hard or gap down at open 3/13)?